Share of Renewable Energy Electricity in 2024 (Calendar Year), Preliminary Report
Japan’s renewable share continues to rise, but the slow growth of variable renewables, persistent reliance on thermal power, and uneven grid flexibility leave it well behind leading countries and in urgent need of accelerated deployment and system reform.
Share of renewable energy electricity in 2024 (calendar year), preliminary report. June 30, 2025. Variable renewable energy in Japan reaches 12 percent, making further expansion of renewable energy an urgent task. Institute for Sustainable Energy Policies, nonprofit organization. June 30, 2025. Summary: the share of renewable energy in domestic electricity generation.
2024年(暦年)の自然エネルギー電力の割合(速報) 2025年6月30日 国内の変動性自然エネルギーが12%に、急がれる自然エネルギーのさらなる拡大 特定非営利活動法人 環境エネルギー政策研究所 2025年6月30日 要旨 国内の発電電力量に対する自然エネルギーの割合
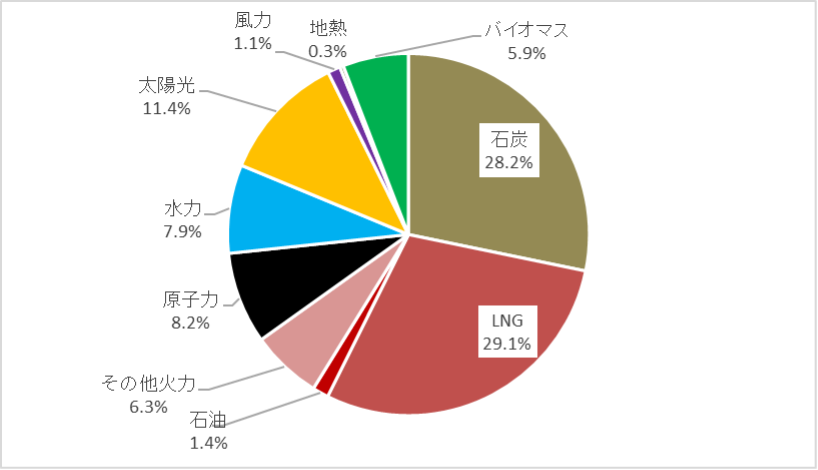
Using the Electricity Survey Statistics [1], nationwide electricity supply-and-demand data, and other sources, we estimated the share of Japan’s total domestic electricity generation in 2024, by power source, including self-consumption [2]. The result shows that renewable energy accounted for 26.7 percent of total electricity generated in Japan in calendar year 2024 (Table 1, Figure 1).
電力調査統計[1]や全国の電力需給データなどより2024年の日本国内の全発電電力量(自家消費を含む)の電源別割合を推計した[2]。その結果、2024年(暦年)の日本国内の自然エネルギーの全発電電力量に占める割合は26.7%となった(表1、図1)。
The share of renewable energy, which had been about 15 percent in 2016, rose by more than one percentage point every year until 2021, reaching 22 percent; in 2024 it rose by one point from the previous year, 2023, to reach 26.7 percent (Figure 2). Within this, electricity generated from solar power reached 11.4 percent, a slight increase from 11.2 percent the previous year, gradually approaching the deployment share of 15 percent assumed in the Basic Energy Plan’s 2030 power mix. Together with wind power’s 1.13 percent share, VRE, or variable renewable energy, accounted for 12.6 percent, only a slight increase from 12.3 percent in 2023. Among renewable sources other than solar power, biomass generation accounted for 5.9 percent, essentially flat from 5.7 percent the previous year. Wind power also rose slightly, to 1.13 percent from 1.07 percent the previous year, and geothermal power also increased marginally, to 0.33 percent. Hydropower rose from 7.5 percent the previous year to 7.9 percent. By month, the share of renewable electricity generation was highest in May 2024, reaching 34.7 percent (Figure 3). In that May, the solar share was high, at 15.8 percent, and the share of variable renewable energy, or VRE, also reached 17.1 percent.
2016年には約15%だった自然エネルギーの割合が、2021年までに毎年1ポイント以上増加して22%に達したが、2024年は前年(2023年)から1ポイント増加して26.7%に達した(図2)。その中で、太陽光発電の発電電力量は11.4%に達して、前年の11.2%からわずかに増加しており、エネルギー基本計画が2030年度の電源構成で想定している導入割合(15%)に徐々に近づいている。風力発電の割合1.13%と合わせると、VRE(変動性自然エネルギー)の割合は12.6%となり、前年(2023年)の12.3%からわずかな増加に留まった。太陽光発電以外の自然エネルギーについては、バイオマス発電の発電電力量の割合は5.9%で、前年の5.7%からほぼ横ばいだった。風力発電も1.13%で前年の1.07%からわずかに増加し、地熱発電も0.33%で前年からわずかに増加した。水力は前年の7.5%から増加して7.9%だった。月別にみると2024年5月の自然エネルギーの発電電力量の割合が最も高く、34.7%に達している(図3)。この5月には太陽光の割合が15.8%と高くなり、変動性自然エネルギー(VRE)の割合も17.1%に達している。
For data on electricity generated by wind power, we use transmitted electricity volumes from the electricity supply-and-demand data published by electric utilities, rather than data from the Electricity Survey Statistics, namely electricity transmitted by electricity businesses and electricity received. For data on electricity generated by solar power, we adopt the Electricity Survey Statistics; however, since these figures are about 10 percent larger in annual transmitted volume than the electricity supply-and-demand data, it should be noted that the estimated share of solar power has a range. Specifically, the estimate from the Electricity Survey Statistics puts annual solar generation at 114.6 TWh, while the transmitted volume in the electricity supply-and-demand data was 93.4 TWh. Since the estimated figure for residential solar power, under 10 kW, is 3.2 TWh, adding that brings the total to 96.6 TWh, more than 10 percent lower, which would make the share of solar power 9.6 percent. The generation estimate from the Electricity Survey Statistics is the sum of reported generation results from electricity businesses, namely retail electricity providers and generators above a certain scale, and electricity received from entities other than electricity businesses; it is therefore possible that the figure is somewhat inflated by double counting or similar factors.
風力発電の発電電力量データについては、電力調査統計のデータ(電気事業者送電量と受電電力量)ではなく、電力会社が公表している電力需給データによる送電量を用いている。また、太陽光発電の発電電力量データについては、電力調査統計のデータを採用しているが、電力需給データと比較すると年間送電量で1割程度大きいため太陽光発電の割合については推計の幅があることに留意が必要である。具体的には、電力調査統計からの推計では、太陽光発電の年間発電電力量は114.6TWhだったが、電力需給データによる送電量では93.4TWhだった。住宅用太陽光(10kW未満)の推計値が3.2TWhのため、それと合わせて96.6TWhとなり、1割以上小さいため、太陽光発電の割合は9.6%となる。電力調査統計からの発電電力量の推計値は、電気事業者(小売電気事業者および一定規模以上の発電事業者)からの発電実績の報告と、電気事業者以外の事業者からの受電電力量を合計した数値のため、ダブルカウントなどにより大きめの数字になっている可能性はある。
Electricity generated by thermal power is on a declining trend. In 2024 it stood at 65.1 percent, down from 66.6 percent the previous year and more than about 18 percentage points lower than in 2016, but it remains at a high level. Coal-fired power fell from 30.2 percent in 2016 to 28.2 percent in 2024. LNG has been on a nearly consistent downward trend, from 38.9 percent in 2016 to 29.1 percent in 2024. Nuclear power, meanwhile, after falling to zero in 2014, rose to 6.5 percent of generated electricity in 2019, declined to 4.8 percent in 2022, and then increased to 8.2 percent in 2024.
火力発電の発電電力量は減少傾向にあり、2024年には65.1%と、前年の66.6%から減少し、2016年からは約18ポイント以上減少したが依然として高いレベルである。石炭火力については、2016年の30.2%から2024年には28.2%に減少した。LNGについては2016年の38.9%から2024年の29.1%までほぼ一貫して減少傾向にある。一方、原子力発電は、2014年にゼロになってから、2019年には発電電力量が6.5%まで増加し、2022年には4.8%まで減少したが、2024年は8.2%に増加した。
Table 1: Trends in the share of renewable energy in Japan’s total electricity generation. Source: prepared by ISEP from the Electricity Survey Statistics and other data.表1: 日本の全発電電力量に占める自然エネルギーの割合の推移 (出所:電源調査統計などよりISEP作成)
Figure 1: Japan’s overall power mix, preliminary 2024 figures. Source: prepared by ISEP from the Electricity Survey Statistics and other data. Figure 2: Trends in the share of renewable energy in Japan’s total electricity generation. Source: prepared by ISEP from the Electricity Survey Statistics and other data.
図1:日本全体の電源構成(2024年速報) 出所:電力調査統計などよりISEP作成 図2:日本の全発電電力量に占める自然エネルギーの割合の推移 (出所:電力調査統計などよりISEP作成)
Figure 3: Monthly share of renewable energy in Japan’s total domestic electricity generation, preliminary 2023 figures. Source: prepared by ISEP from the Electricity Survey Statistics and other data. Figure 4: Trends in annual electricity generation and the power mix in Japan. Source: prepared by ISEP from the Electricity Survey Statistics and other data. Comparison of renewable energy deployment shares with other countries.
図3:日本国内の全発電電力量に占める月別の自然エネルギーの割合(2023年速報) (出所:電力調査統計などよりISEP作成) 図4: 日本国内の年間発電電力量と電源構成の推移 (出所:電力調査統計などよりISEP作成) 海外各国との自然エネルギー導入割合の比較
In the introduction of renewable energy in the electricity sector, initiatives in the EU, or European Union, have led the world since the 1990s. The share of electricity generation for the EU as a whole reached 47.5 percent across the 27 member states in 2024, far exceeding the 29.1 percent share of fossil-fuel generation. This is nearly twice the share of renewable electricity in Japan. The share of variable renewable energy, or VRE, such as solar and wind power, was also 28.6 percent across Europe as a whole, more than double Japan’s roughly 12 percent.
自然エネルギーの電力分野の導入では、1990年代以降、EU(欧州連合)での取り組みが世界的に先行して進んでおり、EU全体での発電電力量の割合も2024年にはEU27か国で47.5%に達し、化石燃料による発電の割合29.1%を大きく上回っている。これは日本国内の自然エネルギー電力の割合の2倍近くに相当する。太陽光発電および風力発電といった変動性自然エネルギー(VRE)の割合も欧州全体で28.6%と、日本国内の約12%の2倍以上に達している。
Figure 5 shows the breakdown of the share of annual electricity generation from renewable energy in 2024 for major European countries, the United States, China, and Japan. The figure is based on the latest 2024 data for the power sectors of countries worldwide, estimated by the British think tank Ember [3]. In Denmark, where the share of variable renewable energy, wind and solar VRE, has already reached 69 percent, renewable energy accounts for 88 percent of annual electricity generation, with wind alone accounting for 58 percent. In Austria, hydropower accounts for 57 percent, and together with wind at 12 percent and solar at 11 percent, the renewable energy share reaches 86.7 percent. The share has reached 85.2 percent in Portugal and 69.5 percent in Sweden; already in Germany, at 57.4 percent, Spain, at 57.2 percent, and the United Kingdom, at 51.5 percent, renewables account for more than 50 percent and exceed the European average. The VRE share has reached 28.6 percent in the EU as a whole, and 43 percent in both Spain and Germany. In France, by contrast, where nuclear power exceeds 68 percent, renewable energy remains at 26 percent.
主要な欧州各国、アメリカおよび中国そして日本の自然エネルギーによる2024年の年間発電電力量の割合の内訳を図5に示す。この図はイギリスのシンクタンクEmberが推計した世界各国の電力部門に関する2024年の最新データ[3]に基づいている。変動性自然エネルギー(風力および太陽光)VREの割合がすでに69%に達しているデンマークでは年間発電電力量に占める自然エネルギーの割合が88%に達しており、風力だけで58%ある。オーストリアでは、水力発電の割合が57%あり、風力12%や太陽光11%と合わせて自然エネルギーの割合が86.7%に達している。ポルトガルでは85.2%、スウェーデンでは69.5%、に達し、すでにドイツ(57.4%)、スペイン(57.2%)、イギリス (51.5%)においても自然エネルギーの割合が50%以上に達して、欧州全体の平均を上回っている。VREの割合はEU全体でも28.6%に達しているが、スペインやドイツでも43%に達している。一方、原発の比率が68%を超えるフランスでは自然エネルギーの割合は26%に留まる。
Figure 5: Comparison of the shares of renewable energy and other sources in electricity generation in European countries, the United States, China, and Japan, 2024. Source: prepared by ISEP from Ember data.
図5:欧州各国およびアメリカ・中国・日本の発電電力量に占める自然エネルギー等の割合の比較(2024年) 出所:EmberのデータよりISEP作成
Comparing trends from the 1990s to 2023 in the share of renewable energy in annual electricity generation in European countries and Japan shows that European countries steadily increased the renewable share from the 1990s toward 2020 (Figure 6). In Denmark, the share was already 17 percent in 2000, exceeded 30 percent in 2010, and reached 87 percent in 2023; the country aims for renewable electricity to exceed 100 percent by 2030 [4]. In Denmark, through two decades of experience in its electricity system since 2000, integrated solutions have been realized in the power system and electricity market to supply more than 50 percent of electricity from wind and solar variable renewable energy, or VRE.
1990年代から2023年までの欧州各国と日本の年間発電電力量に占める自然エネルギーの割合の推移を比べてみると、欧州各国では2020年に向けて1990年代から着実に自然エネルギーの割合を増やしてきたことがわかる(図6)。デンマークでは、2000年の時点ですでに17%だったが、2010年の時点で30%を超え、2023年には87%に達しており、2030年までには自然エネルギー電力が100%を超えることを目指している[4]。デンマークでは、電力システムにおける2000年以降の20年間にわたる経験から、風力および太陽光の変動性自然エネルギーVREで電力の50%以上を賄うための統合ソリューションが電力システムや電力市場において実現している。
Figure 6: Actual deployment and policy targets for renewable electricity in European countries and Japan. Source: prepared by ISEP from Eurostat, Ember data, and other sources.
図6: 欧州各国および日本の自然エネルギー電力の導入実績・政策目標 出所:EU統計局、EmberデータなどからISEP作成
In Germany, the share of renewable electricity was about 7 percent in 2000, but then rose to nearly 20 percent in 2010, reached 45 percent in 2020, and reached 57 percent in 2024 (Figure 7). In response to the Ukraine crisis and in order to break dependence on Russian natural gas, the new 2022 EEG bill, the Renewable Energy Act, set a target of more than 80 percent renewable electricity by 2030 and 100 percent by 2035. Nuclear power, meanwhile, had fallen to zero by the end of 2023, dropping from 29 percent in 2000 to 0 percent in 2024. It had been steadily reduced toward the legally mandated phaseout at the end of 2022, but because of concerns over natural gas supply, measures were taken to keep in service until April 2023 nuclear plants that had been scheduled for closure. Coal, including domestically produced lignite, accounted for 50 percent in 2000, but by 2024 had fallen to 22 percent, below the share of wind power. In addition, Germany’s annual solar power installations reached 15 GW in 2024, about six times Japan’s annual installations of 2.5 GW, and cumulative installed capacity reached around 90 GW, comparable to Japan’s (Figure 8). Germany’s solar deployment target for 2030 is 215 GW, about twice Japan’s, and the annual deployment target will rise from the current 9 GW to 22 GW. For small-scale solar in particular, tax incentives and simplified procedures have advanced, and systems that focus support on rooftop installations on homes and other buildings account for about two-thirds of annual installations.
ドイツでは自然エネルギー電力の割合が2000年には7%程度だったが、その後、2010年には20%近くにまで増加し、2020年には45%に達し、2024年には57%に達している(図7)。ウクライナ危機により、ロシアへの天然ガス依存からの脱却を実現するため、2022年の新たなEEG法案(再生可能エネルギー法)では、再生可能エネルギー電力を2030年には80%以上、2035年には100%を目指すとしている。一方で、原発は2023年末までにゼロとなっており、2000年の29%から2024年には0%となっている。原発全廃と定められた2022年末に向けて着実に減少してきたが、天然ガスの供給懸念により、廃止を予定していた原発を2023年4月まで温存する措置がとられた。ドイツ国内で産出される褐炭を含む石炭の割合は、2000年には50%を占めていたが、2024年には22%まで減少しており、風力発電の割合よりも小さくなっている。さらに、2024年の太陽光発電の年間導入量が15GWに達して、日本の年間導入量2.5GWの約6倍になり、累積導入量も日本と同規模の約90GWになった(図8)。ドイツでは、2030年までの太陽光導入目標が215GW(日本の約2倍)となっており、年間導入目標も現状の9GWから22GWに増える。特に小規模太陽光については、税制優遇や手続きの簡素化が進んでおり、住宅など屋根上での導入を重点的に支援した制度により、年間導入量の約2/3を占めている。
Figure 7: Trends in electricity generated from renewable energy in Germany and its share of total electricity generation. Source: prepared by ISEP from AGEB [5] and Ember data.
図7: ドイツ国内での自然エネルギーの発電電力量と全発電電力量に占める比率の推移 出典:AGEB[5]、EmberデータよりISEP作成
Figure 8: Installed capacity of solar power facilities in countries around the world, end of 2024. Source: IRENA data.図8:世界各国の太陽光発電設備の導入設備容量(2024年末) 出所:IRENAデータ
In the UAE Consensus agreed at COP28 in December 2023 by countries around the world, including Japan, the parties aim to triple global renewable energy generation capacity by 2030 compared with 2022 and to double the global average rate of improvement in energy efficiency. The scale of renewable energy deployment required by 2030 has already been indicated in scenarios and reports by the IEA, or International Energy Agency [6], and IRENA, or International Renewable Energy Agency [7]; renewable energy capacity must be increased from 3.4 TW in 2022 to more than triple that level, 11 TW, by 2030. Achieving this will require 1 TW, or 1,000 GW, of new installations each year [8]. In contrast, in 2024 more than 450 GW of solar power and more than 100 GW of wind power were installed worldwide, meaning that more than 500 GW, or 0.5 TW, of renewable energy capacity was installed in the year (Figure 9).
日本を含む世界各国が2023年12月のCOP28で合意したUAEコンセンサスでは、2030年までに自然エネルギー発電設備の容量を2022年と比べて世界全体で3倍にし、エネルギー効率の改善率を世界平均で2倍にすることを目指している。この2030年までに必要な自然エネルギー導入量は、IEA(国際エネルギー機関)[6]やIRENA(国際自然エネルギー機関)[7]のシナリオやレポート等ですでに示されており、2030年までに再エネの設備容量を2022年の3.4TWから3倍以上の11TWまで増やすことが必要となる。そして、その実現には年間1TW(1000GW)の新規導入が必要になる[8]。これに対して、2024年は世界全体で太陽光発電は450GW、風力発電は100GW以上が導入され、年間500GW(0.5TW)以上の再生可能エネルギー設備が導入されている(図9)。
Figure 9: Trends in global installations of solar power, wind power, and nuclear power. Source: prepared from IRENA, IAEA, and other data.図9: 世界の太陽光発電、風力発電および原子力発電の導入量の推移 出所:IRENA、IAEAなどのデータより作成
At the same time, countries are advancing the deployment of stationary storage batteries, including batteries on the demand side where solar power has been installed and grid-scale batteries to improve the flexibility of power systems. At COP29, held in Azerbaijan in November 2024, more than 60 countries, including Japan, endorsed a pledge to increase storage capacity sixfold by 2030 [9]. China, which ranks first in the world in the deployment of solar and wind power, has made the greatest progress in deploying storage batteries, followed by the EU and the United States (Figure 10). Within the EU, Germany and Italy, where solar power deployment is large, also have large volumes of storage battery deployment, and the level of deployment in Japan is comparable. In Japan, stationary storage batteries with more than 10 GWh of storage capacity have been installed, equivalent to roughly one-tenth of the storage capacity of domestic pumped-storage hydropower. Globally, storage batteries are now being installed at capacities comparable to pumped-storage hydropower, which has until now provided flexibility in power systems.
一方、太陽光発電を設置した需要側の蓄電池や電力系統の柔軟性向上のための系統蓄電池など定置用蓄電池の導入が各国で進んでいる。アゼルバイジャンで2024年11月に開催されたCOP29でも日本を含む60カ国以上が2030年までに蓄電池容量を6倍にする誓約に賛同している[9]。最も蓄電池の導入が進んでいるのは太陽光発電や風力発電の導入が世界第1位の中国であり、EUと米国がそれに続く(図10)。EUの中では太陽光発電の導入量が大きいドイツやイタリアで蓄電池の導入量が大きく、日本国内の導入量も同程度となっている。日本国内でも、蓄電容量で10GWh以上の定置用蓄電池が導入されており、これは国内の揚水発電の蓄電容量の1/10程度に相当する。世界的には、これまで電力システムの柔軟性を担ってきた揚水発電に匹敵する容量の蓄電池が導入されてきている。
Figure 10: Cumulative installed capacity of stationary storage batteries in countries around the world, end of 2024.図10: 世界各国の定置用蓄電池の累積導入量(2024年末)
Source: prepared from European Market Outlook for Battery Storage 2025-2029, materials from the Ministry of Economy, Trade and Industry, and other sources.
出所:European Market Outlook for Battery Storage2025-2029、経産省資料などから作成
In China, the deployment of wind and solar power, in addition to hydropower, has advanced rapidly over the past decade. In 2024, wind power accounted for 9.8 percent of annual generation and solar power for 8.3 percent, bringing the share of VRE, or variable renewable energy, to 18.1 percent (Figure 11). Including hydropower, renewable energy accounted for 33.6 percent of electricity generated. The nuclear share, meanwhile, was 4.4 percent and had been almost flat since 2019, so solar power greatly surpassed nuclear power in electricity generation. The scale of China’s annual domestic electricity generation in 2024, 10,073 TWh, was 3.7 times the EU’s 27-country total of about 2,744 TWh and more than 10 times Japan’s 1,022 TWh. Electricity generation in Europe and Japan is flat or trending downward, but in China it has continued to increase with economic growth, more than doubling over the past decade.
中国では、水力発電に加えて風力や太陽光の導入がこの10年間で急速に進んだ。2024年には年間で風力発電の割合が9.8%、太陽光発電が8.3%でVRE(変動性自然エネルギー)の割合は18.1%に達している(図11)。水力も含めた自然エネルギーによる発電電力量の割合は33.6%に達している。一方、原発の割合は4.4%で、2019年以降ほぼ横ばいだったため、太陽光発電が原発の電力量を大幅に上回った。2024年の中国国内の年間発電電力量の規模(10,073TWh)は、EU(27か国)全体の約2744TWhの3.7倍あり、日本国内の1022TWhの10倍以上である。欧州および日本の発電電力量は横ばいか減少傾向にあるが、中国では経済成長と共に増加を続けており、この10年間で2倍以上になっている。
Figure 11: Trends in electricity from renewable energy and nuclear power in China. Source: prepared from China Energy Portal and Ember data. The share of renewable energy in Japan’s domestic electricity supply and demand.
図11: 中国の自然エネルギーおよび原発の電力量の推移 出所:China Energy Portal およびEmberデータより作成 日本国内の電力需給における自然エネルギーの割合
Based on electricity supply-and-demand data published monthly by the ten general transmission and distribution utilities for each area across Japan, we aggregated data for the full calendar year 2024, focusing on the share of renewable energy in grid electricity demand. For electricity supply-and-demand data in Japan, ISEP’s Energy Chart makes it possible to analyze published data interactively and clearly through a variety of graphs [10].
日本全国のエリア毎に一般送配電事業者10社により毎月公開されている電力需給データに基づき系統電力需要に対する自然エネルギーの割合などを中心に2024年(暦年)の一年間のデータを集計した。日本国内の電力需給データについてはISEPのEnergy Chartでは公表されたデータから様々なグラフでインタラクティブに分かり易くデータを分析できる[10]。
The share of renewable energy in Japan’s total annual electricity demand averaged 23.2 percent in calendar year 2024, up from the 2023 annual average of 22.5 percent (Figure 12). In the breakdown, solar power accounted for 10.6 percent; together with wind power at 1.3 percent, the share of variable renewable energy, or VRE, was 11.9 percent. Solar fell from 10.8 percent in 2023, but its share was larger than that of hydropower, at 8.2 percent. Biomass power increased from 2.3 percent the previous year to 2.8 percent. Nuclear power’s share in 2024 was 9.8 percent, up from 9.0 percent the previous year.
日本全体の年間電力需要量に対する自然エネルギーの割合は2024年(暦年)の平均値では23.2%となり、2023年の年平均22.5%から増加した(図12)。内訳としては太陽光発電の割合が10.6% となり、風力発電の1.3%と合わせて変動性自然エネルギーVREの割合は11.9%となった。太陽光は2023年の10.8%から減少しているが、水力発電の8.2%より割合が大きくなっている。バイオマス発電は前年の2.3%から2.8%に増えている。一方、2024年の原発の割合は9.8%となり、前年の9.0%から増加した。
Figure 12: Monthly shares of renewable energy and nuclear power in nationwide electricity supply and demand in Japan, 2024. Source: prepared from electricity supply-and-demand data of general transmission and distribution utilities.
図12: 月別の日本全国の電力需給における自然エネルギーおよび原発の割合(2024年) 出所:一般送配電事業社の電力需給データより作成
In monthly averages of the share of renewable energy in electricity demand for Japan as a whole, May 2024 was the highest, at 32.2 percent, down from 32.5 percent the previous year. At that time the share of VRE, or variable renewable energy, was also at its maximum, 16.9 percent, higher than the 16.5 percent recorded in May of the previous year. The breakdown was 15.4 percent solar power and 1.5 percent wind power. In daily averages, the share reached 43.7 percent on May 3, 2024, and VRE also reached its maximum that same day, at 25.7 percent. In hourly values for the renewable energy share, the annual peak was 80.1 percent during the 11 a.m. hour on the same May 3; solar reached 63.7 percent, and together with wind power at 2.0 percent, the VRE peak value was 65.7 percent. The peak value for wind power, incidentally, was 5.3 percent in the early hours of October 20, 2024.
日本全体の自然エネルギーの電力需要に占める割合の月別の平均値では、2024年5月が32.2%と最も高くなっており、前年の32.5%から減少している。このときVRE(変動性自然エネルギー)の割合も最大で16.9%となり、前年5月の16.5%よりも高い。その内訳は、太陽光発電が15.4%、風力発電が1.5%となっている。1日の平均値では2024年5月3日に43.7%に達しており、VREについても同日の25.7%が最大だった。自然エネルギー割合の1時間値では同じ5月3日11時台の80.1% が1年間のピークで、太陽光が63.7%に達しており、風力発電の2.0%と合わせてVREのピーク値は65.7%になっている。ちなみに風力発電のピーク値は2024年10月20日未明の5.3%だった。
By electric utility, or general transmission and distribution utility, area, the highest average share of renewable energy in annual electricity demand in calendar year 2024 was in the Tohoku area, at 41.5 percent (Figure 13). Solar accounted for 13.5 percent and wind for 5.8 percent, bringing the VRE share to 19.3 percent; biomass power, at 6.7 percent, and geothermal power, at 1.5 percent, were the highest in the country, while hydropower also accounted for a large share, at 14.0 percent. The Hokkaido area ranked second with a renewable energy share of 40.1 percent, but its wind power share, at 9.7 percent, was the highest in the country, and its VRE share, at 20.3 percent, was also the highest in Japan. The average for eastern Japan as a whole in 2024 was a renewable energy share of 22.2 percent, below the national average of 22.8 percent. A major factor is that the Tokyo area remained at 14.9 percent. The VRE share, however, was 12.0 percent, above the national average of 11.8 percent. The reason is that the wind power share was 2.1 percent, above the national average of 1.3 percent.
電力会社(一般送配電事業者)のエリア別では、2024年(暦年)の年間電力需要量に対する自然エネルギーの割合の平均値が最も高かったのは東北エリアの41.5%だった(図13)。太陽光が13.5%、風力が5.8%になり、VRE割合は19.3%となっているが、バイオマス発電は6.7%、地熱発電は1.5%で全国で最も高く、水力発電も14.0%と大きな割合を占めている。北海道エリアの自然エネルギー割合は40.1%で第2位だったが、風力発電の割合が9.7%と全国で最も高くなっており、VRE割合も20.3%で全国で最も高くなっている。2024年の東日本全体の平均では自然エネルギーの割合が22.2%と全国平均の22.8%を下回っている。これは東京エリアが14.9%に留まっていることが大きな要因となっている。一方で、VREの割合は12.0%となり、全国平均11.8%を上回っている。これは、風力発電の割合が2.1%で、全国平均の1.3%を上回っていることが要因になっている。
Figure 13: Share of renewable energy in electricity supply and demand by area, 2024. Source: prepared from electricity supply-and-demand data of general transmission and distribution utilities.図13: エリア別の電力需給における自然エネルギーの割合(2024年) 出所:一般送配電事業社の電力需給データより作成
In 2024, the renewable energy share for central and western Japan as a whole was 24.0 percent, above the national average of 23.2 percent, while the VRE share, combining solar at 11.1 percent and wind at 0.6 percent, was 11.7 percent. Nuclear power, by contrast, was almost zero in eastern Japan, at 0.1 percent, but was operating in central and western Japan in the Kansai, Kyushu, and Shikoku areas; its share was 17.7 percent, far exceeding VRE and rising substantially from 10.7 percent the previous year. In the Hokuriku Electric Power area, which ranked third in renewable energy share, the figure reached 37.1 percent in 2024. Solar was 5.8 percent and wind 0.5 percent, making the VRE share a relatively low 6.3 percent, while hydropower accounted for 28.5 percent, the highest share in Japan. In the Shikoku area, which ranked fourth in renewable energy share, the figure was 35.0 percent, up from 34.4 percent in 2023, while the nuclear share was essentially flat at 21.9 percent, compared with 21.7 percent the previous year. In the Shikoku area, solar accounted for 16.2 percent, as in the Kyushu area, the highest share in the country; combined with wind at 2.0 percent, the VRE share was 18.2 percent, among the higher levels nationwide after Hokkaido, at 20.3 percent, and Tohoku, at 19.3 percent. In the Kyushu area, the renewable energy share was 29.9 percent and the VRE share 17.1 percent. Of this, solar accounted for 16.2 percent, up from 15.8 percent the previous year, while wind accounted for 0.9 percent. At the same time, the nuclear share reached 34.5 percent, the highest in the country together with Kansai Electric Power.
2024年の中西日本全体の自然エネルギーの割合は、24.0%と全国平均の23.2%を上回っているが、太陽光11.1%と風力0.6%を合わせてVREの割合は11.7%となっている。一方、東日本では稼働がほぼゼロ(0.1%)の原発が、中西日本では関西エリア、九州エリアおよび四国エリアで稼働しており、その割合はVREを大幅に上回る17.7%で、前年の10.7%からかなり増加している。自然エネルギーの割合が第3位の北陸電力エリアでは、2024年には37.1%に達しているが、太陽光は5.8%、風力の割合は0.5%でVRE割合は6.3%と比較的低い一方、水力発電の割合が28.5%と全国の中で最も高くなっている。自然エネルギーの割合が第4位の四国エリアでは、35.0%となり2023年の34.4%から増加したが、原発の割合は前年の21.7%から横ばいで21.9%だった。四国エリアでは、太陽光が16.2%で九州エリアと共に全国で最も割合が高く、風力2.0%を合わせたVREの割合が18.2%と北海道エリア(20.3%)や東北エリア(19.3%)に次いで全国の中で高いレベルになっている。九州エリアでは自然エネルギーの割合は29.9%で、VREの割合は17.1%だった。このうち太陽光は16.2%で、前年の15.8%より増加しており、風力は0.9%だった。一方で、原発の割合が34.5%に達して関西電力と共に全国で最も高くなっている。
In 2024, there were five areas where renewable energy exceeded 100 percent of electricity demand in hourly values: Hokkaido, Tohoku, Hokuriku, Shikoku, and Chugoku (Figure 10). Among these, in the Tohoku area, the share of renewable energy relative to electricity demand reached 131.5 percent during the 11 a.m. hour on April 21, 2024. At that peak, solar was 92.4 percent and wind 5.5 percent, making the VRE share 97.9 percent. Adding hydropower at 24.9 percent and biomass at 6.6 percent brings the total to 131.5 percent. In the Chugoku area, the renewable energy share reached a maximum of 115.4 percent, and the VRE share also reached 104.7 percent, with solar at 103.1 percent and wind at 4.1 percent. In the Kyushu area, where the curtailment rate is highest, the solar share in hourly values reached a maximum of 94.8 percent at its peak. The VRE ratio also remained at a maximum of 83.7 percent. Before curtailment, however, the VRE ratio in the Kyushu area reached a maximum of 113.9 percent, and VRE curtailment suppressed the VRE ratio to 54 percent, a curtailment rate of 46 percent.
2024年には1時間値で自然エネルギーが電力需要の100%を超えるエリアが、北海道、東北、北陸、四国、中国の5エリアになった(図10)。この中で、東北エリアでは、2024年4月21日11時台に自然エネルギーの電力需要に対する割合が131.5%に達した。このピーク時に太陽光が92.4%、風力が5.5%でVREの割合が97.9%だった。さらに、水力の24.9%、バイオマス6.6%を合わせて131.5%となっている。中国エリアで、自然エネルギーの割合が最大115.4%に達して、VREの割合も104.7%となっている(太陽光103.1%、風力4.1%)。出力抑制の割合が最も高い九州エリアでは、1時間値で太陽光の割合がピーク時に最大94.8%だった。VRE比率も最大83.7%に留まっている。一方、九州エリアでは、出力抑制前のVRE比率は、最大で113.9%に達しており、VREの出力抑制によりVRE比率は54%まで抑制されている(出力抑制率46%)。
In the Kyushu area, curtailment of VRE, solar and wind power, has been implemented among Japan’s areas since 2018, but the VRE curtailment rate over the full year 2024 was 4.4 percent, a sharp decline from 8.9 percent in fiscal 2023. The Kyushu area has about 4 million kW of nuclear power capacity, and in 2024 the nuclear share of electricity was 34.5 percent, about the same as the previous year. By around April 2023, VRE curtailment had also begun in other areas except the Tokyo area. In areas where nuclear power is operating, the share of VRE output curtailment was 2.9 percent in Shikoku and 2.1 percent in Kansai. In areas without operating nuclear power, curtailment was kept low: 0.04 percent in Hokkaido, 1.2 percent in Hokuriku, 0.33 percent in Chubu, and 0.18 percent in Okinawa; by contrast, the Chugoku area had a relatively high VRE curtailment share of 2.36 percent. The national average curtailment rate was 1.5 percent, down from 1.7 percent the previous year. The rules for VRE curtailment have been revised, and the use of online control for VRE is advancing, but the rules have become more complex and the electricity system as a whole has not yet been optimized. In the Kyushu area, interregional interconnection lines are gradually being used effectively, but supply-and-demand adjustment over a wider region that includes the Shikoku, Chugoku, and Kansai areas is still insufficient; further improvements in the operation of interconnection lines, including those in other areas, and reinforcement of interconnections are therefore required. There are areas such as Kyushu where pumped-storage hydropower is being used sufficiently and other areas where it is not yet being fully used. The first requirements are to promote and optimize online control of VRE and to review the minimum output of thermal power plants; going forward, the use of storage batteries, DR, or demand response, VPPs, or virtual power plants, and other resources will be required.
九州エリアではVRE(太陽光および風力)の出力抑制が2018年から全国のエリアの中で実施されているが、2024年の1年間を通じたVREの出力抑制率は4.4%となり、2023年度の8.9%から大幅に減少した。九州エリアには約400万kWの原発があり、2024年は原発の電力量の割合は34.5%と前年並みだった。2023年4月頃までに東京エリアを除く他のエリアでもVREの出力抑制が始まっている。原発が稼働する四国エリアではVRE出力抑制の割合が2.9%、関西エリアが2.1%だったが、原発が稼働しないエリアとしては、北海道エリアが0.04%、北陸エリアが1.2%、中部エリアが0.33%、沖縄エリアが0.18%と低く抑えられている一方で、中国エリアが2.36%とVRE出力抑制の割合が高くなっている。全国平均の出力抑制率は1.5%となり、前年の1.7%より減少した。これまでVREの出力抑制ルールの見直しが行われ、VREのオンライン制御の活用が進みつつあるが、ルールが複雑化し電力システム全体ではまだ最適化されていない状況にある。九州エリアでは地域間連系線は有効に活用されるようになってきているが、四国エリアや中国エリア、そして関西エリアを含めた広域での需給調整が十分に行われていない状況のため、他のエリアを含めてさらなる連系線の運用の改善と連系線の増強が求められる。揚水発電が十分に活用されている九州エリアとまだ十分に活用されていないエリアがあり、まずはVREのオンライン制御の促進および最適化、火力発電の最低出力の見直し、今後は蓄電池の活用、DR(デマンドレスポンス), VPP(バーチャルパワープラント)などの活用が求められる。
References:参考:
[1] Electricity Survey Statistics, http://www.enecho.meti.go.jp/statistics/electric_power/ep002/
[1] 電力調査統計 http://www.enecho.meti.go.jp/statistics/electric_power/ep002/
[2] In the estimate, figures from the previous year are used for estimates of captive generation and self-consumption of residential solar power from October 2021 onward, but the effect is considered small.
[2] 推計では2021年10月以降の自家発、家庭用太陽光の自家消費量推計については前年値を用いているが、影響は小さいと考えられる。
[3] Ember (2025), “Global Electricity Review 2025,” https://ember-energy.org/latest-insights/global-electricity-review-2025/
[3] Ember(2025) “Global Electricity Review 2025”, https://ember-energy.org/latest-insights/global-electricity-review-2025/
[4] Danish Energy Agency, “Development of Flexibility and Its Role in Denmark’s Power System,” https://www.isep.or.jp/archives/library/13612
[4] デンマーク・エネルギー庁「デンマークの電力システムにおける柔軟性の発展とその役割」https://www.isep.or.jp/archives/library/13612
[5] AGEB, “STROMMIX 1990-2023,” https://ag-energiebilanzen.de/ [6] IEA (2023), “Net Zero Roadmap.”
[5] AGEB “STORMMIX 1990-2023” https://ag-energiebilanzen.de/ [6] IEA(2023) “Net Zero Roadmap”
[7] IRENA (2023), “World Energy Transitions Outlook 2023: 1.5°C Pathway.”
[7] IRENA(2023) “World Energy Transitions Outlook 2023: 1.5°C Pathway”
[8] IRENA (2024), “Delivering on the UAE Consensus: Tracking Progress toward Tripling Renewable Energy Capacity and Doubling Energy Efficiency by 2030.”
[8] IRENA(2024) “Delivering on the UAE Consensus: Tracking progress toward tripling renewable energy capacity and doubling energy efficiency by 2030”
[9] COP29 Global Energy Storage and Grids Pledge, https://cop29.az/en/pages/cop29-global-energy-storage-and-grids-pledge
[9] COP29 Global Energy Storage and Grids Pledge https://cop29.az/en/pages/cop29-global-energy-storage-and-grids-pledge