Analysis: China’s CO2 climbs 2% in early 2026 due to ‘wasted’ wind and solar
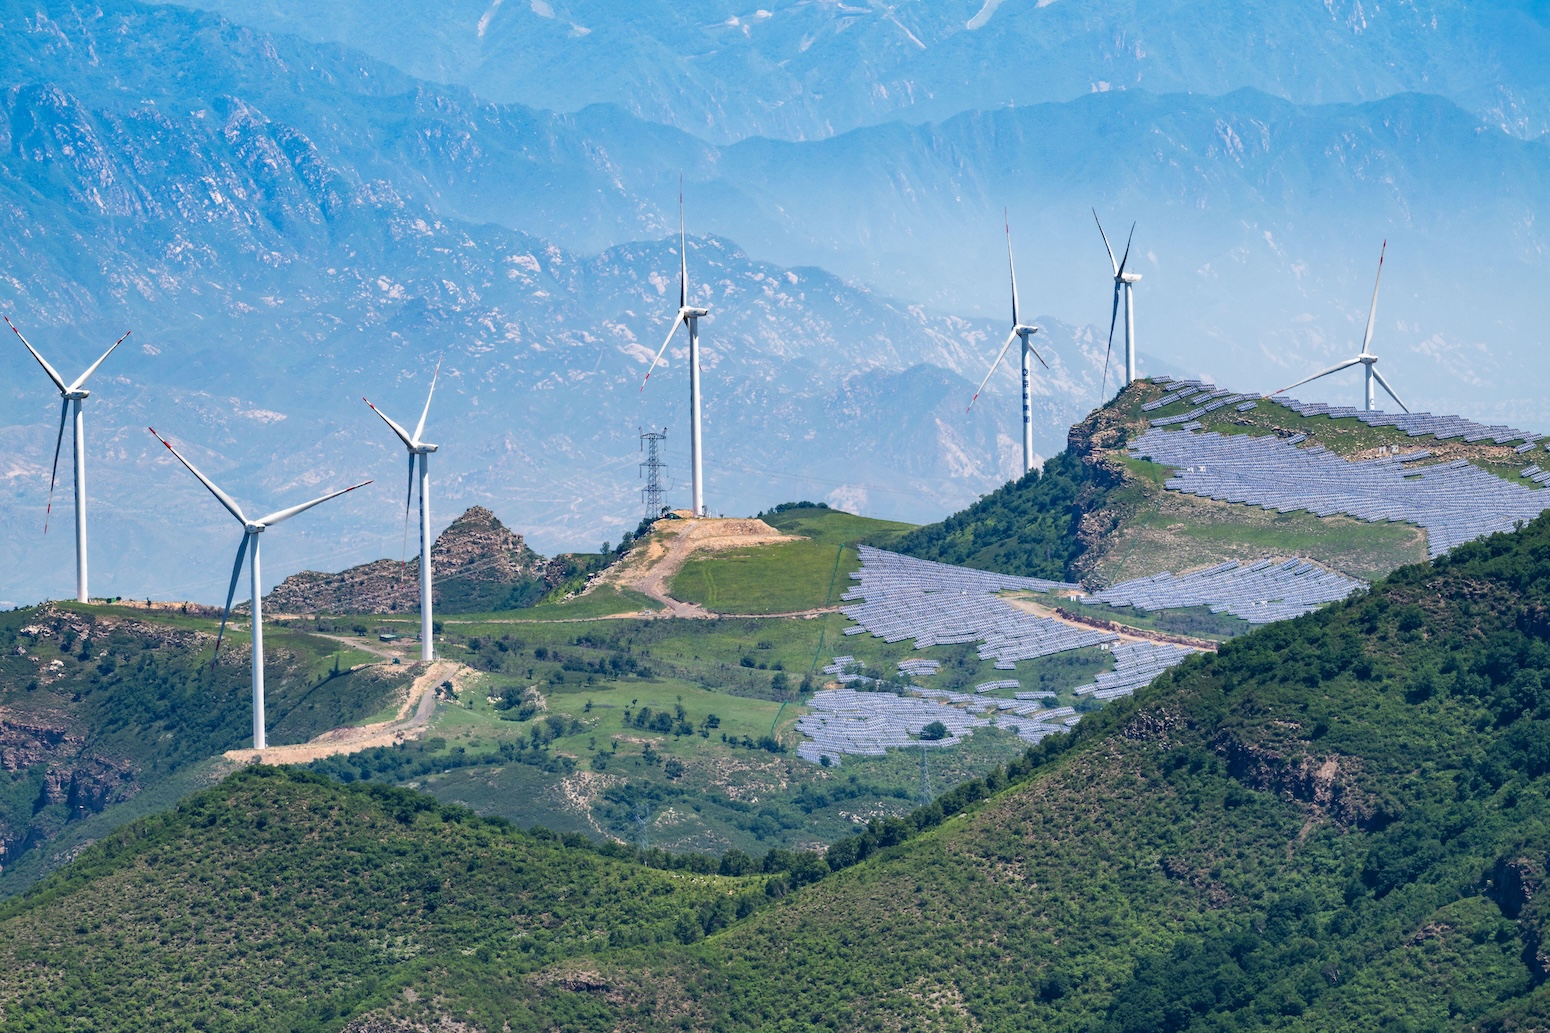
04.06.2026 | 12:01amChina’s carbon dioxide (CO2) emissions grew by 2% in the first quarter of 2026, after a rise in the amount of “wasted” wind and solar power.
The country used more coal and gas to generate electricity than in the same quarter a year earlier, despite a record amount of new wind and solar capacity being built.
While the strait of Hormuz crisis has boosted China’s focus on energy security – including through clean energy and electrification – its electricity system is failing to keep up.
The new analysis for Carbon Brief shows that, while China’s CO2 emissions from fossil fuels and industry increased in the first part of 2026, they remain below the peak in early 2024.
Other key findings for the first quarter of 2026 include:
- There was a 23% year-on-year rise in wind-power capacity and 33% for solar.
- There was also a sharp rise in the amount of wind and solar output being “wasted”, as it was not accommodated by the current electricity system.
- As a result, emissions in the power sector increased by 4% year-on-year.
- Power-sector CO2 would have been flat without the rise in “wasted” wind and solar.
- Emissions in other sectors of the economy grew by 1%.
The key reason for “wasted” wind and solar generation was the inflexible management of coal power plants and power grids, not a lack of grid infrastructure.
In the first quarter of 2026, China’s energy system also began to adjust to the surge in oil and gas prices due to the blockade of the strait of Hormuz.
This continued through April and May, with sharp reductions in oil imports and oil-based chemicals production, as well as the share of gas in electricity generation.
However, the inability to make full use of new wind and solar power plants left China more exposed to the closure of the strait of Hormuz, by increasing the need for other fuels.
This exposure could become more acute if the “super El Niño” that is forecast for later this year limits the electricity output of hydropower, while fossil-fuel supplies remain tight.
Nevertheless, the Hormuz crisis could result in China following a lower-CO2 trajectory than previously expected, if key policies in its 15th five-year plan are fully implemented.
Emissions plateau continues
Recent analysis for Carbon Brief showed that China’s CO2 emissions from fossil fuels and industry had been “flat or falling” for nearly two years.
The latest analysis points to a rise of 2% year-on-year in the first quarter of 2026, as shown in the figure below. For now, however, emissions remain below the peak in March 2024.
In previous quarters, emissions had fallen in almost every sector of the economy, with the exception of the coal-based chemicals industry.
The latest quarter saw more widespread increases, with the power sector by far the largest source of emissions growth, as shown in the figure below.
Emissions from other sectors were relatively stable in aggregate, with some rising and others continuing to decline.
Coal consumption in the chemical industry continued strong growth, increasing by 20%, but showed no change in trend after the closure of the strait of Hormuz and surge in oil prices.
(This is contrary to some commentary arguing that the closure of the strait of Hormuz has resulted in a marked increase in the output of China’s coal-chemicals industry.)
The apparent consumption of oil products rebounded in January-February, driven by transportation, but declined slightly in March as oil prices surged.
Emissions from the cement and steel industries continued to fall, as real estate investment contracted another 11% in the first quarter of 2026, following a 17% reduction in 2025. Cement production fell 7% and crude steel output by 5%.
‘Wasted’ wind and solar power
After falling in 2025, power generation from coal and gas increased by 4% in the first quarter of the year.
Power demand grew at 5.2% and hydropower generation increased 9%. Under these circumstances, the record growth in solar and wind power capacity in 2025 should have covered demand growth and pushed fossil-power generation down.
The trend was accentuated in March, as power demand grew just 3.5%, hydropower output increased 9% and yet fossil-power generation increased 4.2%.
The reason for fossil-power generation growth was a sharp drop in the electricity output per unit of installed capacity for both solar and wind power, known as the “capacity factor”.
If capacity factors were stable, the increased solar and wind capacity would have been expected to result in 160 terawatt hours (TWh) of additional clean-power generation during the first quarter, compared with the same time last year, with nuclear and hydro bringing the total to 170TWh. This would have comfortably exceeded the 120TWh increase in power demand.
However, the actual increase in clean-power generation was just 60TWh, with wind showing almost no growth.
While wind power capacity grew by 23% from the first quarter of 2025 to the same period in 2026, an increase of 120GW, the average capacity factor fell from 27% to 22%, a reduction of 18%. This implies that power generation from wind only grew 1% year-on-year. In the case of solar, capacity grew by 33%, but the average capacity factor fell by 11%, resulting in 18% growth in solar-power generation.
It is normal for solar and especially wind capacity factors to vary year-to-year due to weather conditions, but the fall this year was an extension of a longer trend. The average capacity factors of solar and wind have fallen by 19% and 10%, respectively, from 2022 to 2025.
A quarter of the fall in capacity factors over the three-year period is explained by the increase in reported curtailment. This refers to the amount of electricity that is effectively “wasted”, or curtailed, because it cannot be accommodated by the power network.
Nor can the remainder of the fall in capacity factors be explained by the change in weather conditions, as both wind and solar conditions improved on a national-average basis from 2022 to 2025.
In the first quarter of 2026, approximately half of the drop in wind capacity factor and a quarter of the drop in solar capacity factor was explained by weather conditions, implying that the rest is due to increased curtailment resulting from inadequate grid management and integration.
One clear symptom of increased curtailment is that in January-February, both solar and wind conditions were actually better than last year, but capacity factors still fell.
The fact that capacity factors have fallen significantly more than would be expected based on reported curtailment and weather conditions indicates that a lot of curtailment goes unreported, either because it is excluded from the statistical definition, or because there are gaps in reporting.
Market participants have long noted that actual curtailment is much higher than reported in official statistics.
Official data on curtailment only includes “system reasons”, while excluding some lost generation linked to market trading, grid-connection conditions and other “special” causes.
The figure below shows actual electricity generation from wind and solar plants (dark blue), the amount that would have been generated if reported curtailment had not taken place (light blue) and the level expected if the rate of curtailment had stayed the same (mid-blue).
In total, wind and solar could have generated an extra 170TWh of electricity in the first quarter of 2026, if the rate of curtailment had not gone up in the preceding years. This is more than the total power generation of France over the same period.
The largest reductions in capacity factors, after controlling for variations in weather conditions, came from Inner Mongolia, Xinjiang and Liaoning. In these northern provinces, the heating season is a challenging time for grid managers due to inflexible operation of plants that provide both heat and power.
More broadly, the key reason for curtailment is inflexible grid management. Flexible operation of coal and gas-fired power plants could very substantially increase the amount of solar and wind power the grid can accommodate.
Yet currently, coal-fired power generation is largely operated via medium- and long-term contracts to supply fixed amounts of electricity at fixed prices, meaning there is no incentive for adjustments in output to make space for solar and wind.
Similarly, electricity trading between provinces is predominantly contracted annually, preventing the variable output of solar and wind from being transmitted between jurisdictions in real time.
These issues have a clear impact on the amount of wind and solar that is curtailed. For example, power-system modeling carried out for the year 2023 indicates that flexible power-grid operation would have essentially eliminated the need for curtailment.
The government has also recognised solar and wind curtailment as one of the central challenges of the energy transition.
Recent policies have called for increased inter-province trading and improved flexibility of coal-power plants as the solutions, implicitly recognising these as key issues to address.
Recent large increases in storage capacity, including pumped hydro and batteries, should have improved the integration of wind and solar into the grid. But there is a lack of incentives for storage operators that limits the benefits the system can derive from the technology.
The government has implicitly recognised this and called for establishing electricity pricing that enables energy storage to “participate fairly”.
Meanwhile, China’s new renewable-pricing rules, which shifted existing solar and wind plants to selling electricity on the market, rather than being compensated directly by the grid operator, does not seem to have reduced curtailment so far.
Most provinces only finalised their plans for implementing the policy in late 2025, which left little time for the market and operators to adapt.
China is aiming to build a “new type power system”, capable of integrating large amounts of wind and solar into the grid by 2027. In the meantime, the government has also called for “reasonably pacing” utility-scale “new energy” capacity additions to match the pace at which provinces think they are able to improve the “regulation capacity” of their grids.
How the Hormuz crisis is affecting China’s energy sector
China’s energy system has started, since March, to adjust to the surge in oil and gas prices triggered by the closure of the strait of Hormuz. There have been sharp reductions in oil imports, the share of gas in thermal power generation and in oil-based chemical production.
The consumption of gas fell overall in March, even as consumption in the power sector increased. The power sector fuel mix shifted from gas to coal, but the increase in overall thermal power generation still pushed gas use up in the sector.
High gas prices had already been straining household finances before the current crisis. Millions of households were shifted from coal stoves to gas-based heating as a part of efforts to tackle air pollution during the past decade. However, the gas-price subsidies created to enable this shift have expired in recent years, leading to a rise in heating bills.
China’s oil imports started falling sharply immediately after oil prices surged, with net imports falling even further as exports were restricted. The fall has continued into May, with shipments falling by over 40% year-on-year in the first three weeks of the month.
In the first quarter of the year, state-owned oil major Sinopec reported oil product sales up 4.8%. Apparent consumption of oil products had increased 5.5% in January-February, but fell -0.3% in March, indicating an early impact of the price surge, although the late timing of the Chinese New Year also had an effect.
Electric vehicles have continued to gain market share in 2026, reaching 53% of vehicle sales in April, up from 47% a year ago.
Electricity demand for EV charging grew over 50% year-on-year in March. The large number of plug-in hybrid vehicles on the road means that drivers can switch from petrol to power quickly when there is more of an incentive to do so.
Moreover, 24% of highway trips during the 1 May holiday were made by EVs, even though they only make up 15% of all registered cars. This shows that EVs tend to be driven more than average, making a bigger dent in oil use than their share in the fleet would suggest.
Crude oil processing volumes fell by 2% in March and 6% in April, after growth in January-February. Plastics output growth moderated in March and turned into a decline in April.
The increase in oil prices has boosted the profitability of the highly carbon-intensive coal-to-chemicals industry. There has also been speculation that the industry would have forcefully increased output in response to the Hormuz crisis, enabling China to cut back on oil use. The industry was, however, already operating at high capacity utilisation before the current crisis, reported at an average of 87% in the first half of 2025. This means there was little headroom in the sector to raise output in the short term.
Coal use in the chemical industry increased 19% in January-February and 22% in March, showing a rapidly rising trend, but no step change after the start of the crisis.
The global fossil-fuel crisis is also affecting China’s clean-energy industry through overseas demand. Exports of solar, batteries and EVs recorded 56% growth year-on-year in the first quarter, reaching $55bn. This increase was partially driven by front-loading of shipments ahead of changes to tax rebates to solar and battery exports at the end of March, but the value of exports also grew 38% in April, an indication of strong underlying demand.
Implications of the crisis for China’s transition
The oil-and-gas crisis represents an opportunity for both clean energy and coal. The economics of electrification and clean-energy production, as well as of domestic coal production, have improved dramatically as imported fossil fuels have become more expensive.
At least as importantly, the closure of the strait of Hormuz and the resulting global fossil-fuel crisis closely mirror Chinese policymakers’ long-standing concern about reliance on seaborne fossil fuels. This is likely to reinforce their focus on energy security.
The previous fossil-fuel crisis, in 2021-2022, led to a new wave of coal-power plants, coal mines and coal-to-chemicals plants being built in China.
This time around, any expansion in coal mining is expected to be limited, both by the government’s “anti-involution” drive, which aims to stem harmful price competition, as well as by the carbon constraints in China’s climate goals.
Domestic coal production fell in the first four months of the year, despite a rise in oil and gas as well as coal prices. Rising coal prices will reduce the profitability of coal-fired power generation, at least for the next few months.
The perceived need for further new coal-power projects is also limited by the fact that, after record additions in 2025, there was still another 206GW of coal-fired capacity under construction in January, due to large volumes of permitting during the previous five years.
The energy regulator recently called on provinces to “strictly limit” the addition of new coal-power plants and other “regulating” power capacity in areas with sufficient firm capacity.
There is also a ceiling on the upside for coal in the current crisis, because gas plays a limited role in China’s energy system. This leaves little space for replacing gas with coal.
The exception is the coal-to-chemicals industry, which can replace oil and gas, albeit at the cost of very high carbon emissions. As a result, investment in the industry will likely get a further boost, even though the economic incentive is lower than it may seem.
While crude oil prices for delivery this summer have increased by more than $40 per barrel since the start of the year, 2030 prices are only up $5. This is a more relevant benchmark, given that a new coal-to-chemicals plant will take several years to build and commission.
…the piece continues at the source.