Share and Deployment Status of Renewable Electricity in Japan in FY2024 (Preliminary Report)
Japan’s renewable electricity share edged up to 26.5 percent in FY2024, but variable renewables remain dominated by solar power and the country still needs a substantial acceleration to meet its 2030 target.
Share and Deployment Status of Renewable Electricity in Japan in FY2024 (Preliminary Report), October 31, 2025. Share and Deployment Status of Renewable Electricity in Japan in FY2024 (Preliminary Report): The share of renewable electricity rises slightly to 26.5%, with VRE entering the 12% range. Institute for Sustainable Energy Policies, a specified nonprofit corporation, October 31, 2025.
国内の2024年度の自然エネルギー電力の割合と導入状況(速報) 2025年10月31日 国内の2024年度の自然エネルギー電力の割合と導入状況(速報) 自然エネルギー電力の割合は26.5%に微増、VREは12%台に 特定非営利活動法人 環境エネルギー政策研究所 2025年10月31日
In order to assess the extent to which renewable energy has been introduced in Japan, this preliminary report presents the latest data through the end of FY2024 on such matters as the share of renewables in annual electricity generation, the capacity of renewable power generation facilities installed under the FIT system, and shares by electricity supply-and-demand area.
日本国内で自然エネルギーがどれだけ導入されているかを評価するため、年間発電電力量に占める自然エネルギーの割合、FIT制度で導入された自然エネルギー発電設備の容量、電力需給エリア別の割合などについて、2024年度末までの最新データを速報値として示す。
Summary: Share of renewable electricity in FY2024.要旨 2024年度の自然エネルギー電力の割合
An estimate of the share of annual electricity generation in Japan supplied by renewables in FY2024 shows a rise of about 0.4 percentage points from the previous fiscal year, to 26.5% (Figure 1). This corresponds to roughly 70% of the target set for FY2030 in the Sixth Strategic Energy Plan (36-38%), but an increase of around another 11 percentage points in renewables is still required. Until FY2012, the share of annual electricity generation from renewables in Japan hovered at around 10%; by FY2024, however, annual renewable electricity generation had increased to roughly 2.4 times its FY2012 level, owing in particular to the deployment of renewable power generation facilities under the FIT system. The renewable energy source that increased the most was solar power, which reached 11.5% of Japan’s annual electricity generation. Although this was only about 0.2 percentage points higher than the previous fiscal year’s 11.3%, it was roughly 15 times the FY2012 level. Biomass generation, too, is nearly five times its FY2012 level, and its share has reached 6.0%. Wind power, by contrast, remains low at 1.2%, though it has more than doubled compared with FY2012. Geothermal remains at 0.3%, about 1.3 times its FY2012 level. The share of variable renewable energy (VRE), combining solar and wind, was about 12.6%; yet wind power in Japan has only just entered the 1% range, and its annual generation remains at roughly one-tenth that of solar power. Looking at renewable generation in FY2024 by month, the share was highest in May 2024, reaching 34.7%, with hydropower at 11.2% and solar at 15.8%. The share of variable renewable energy (VRE) was likewise highest in May 2023, reaching 16.5% (Figure 2).
日本国内での2024年度の自然エネルギーによる年間発電電力量の割合を推計したところ前年度から約0.4ポイント増加して26.5%となった(図1)。これは、第6次エネルギー基本計画で2030年度の目標とされている目標(36~38%)の約7割に相当するが、なお約11ポイント分の自然エネルギーの増加が必要である。日本国内では2012年度まで自然エネルギーの年間発電電力量の割合は約10%程度で推移していたが、特にFIT制度による自然エネルギー発電設備の導入により2012年度と比較して2024度には自然エネルギーの年間発電電力量は約2.4倍に増加した。最も増加した自然エネルギーは太陽光発電で、国内の年間発電電力量の11.5%に達し、前年度の11.3%から約0.2ポイントの増加に留まったが、2012年度と比較すると約15倍となっている。バイオマスも2012年度と比較して発電電力量が5倍近くとなり、割合も6.0%に達する。一方で、風力の割合は1.2%と低いが、2012年度と比べて2倍以上になっている。地熱は0.3%に留まっており、2012年度から1.3倍程度である。変動性自然エネルギー(VRE)の割合は太陽光と風力を合わせて約12.6%となったが、風力発電の割合は、日本ではようやく1%台で年間発電電力量は太陽光発電の10分の1程度にとどまっている。2024年度の自然エネルギーの発電電力量を月別にみると2024年5月の割合が最も高く、34.7%に達しており、水力が11.2%に対して太陽光が15.8%となっている。変動性自然エネルギー(VRE)の割合は、同じく2023年5月に最も高く、16.5%に達する(図2)。
The share of renewables in annual electricity generation in Japan is estimated by compiling sources such as the Electric Power Survey Statistics published by the Agency for Natural Resources and Energy. These statistics aggregate data, mainly for generation facilities with output of 1 MW or more, from electric power businesses across the country (about 1,660 companies in FY2024), and also survey such items as electricity received from other businesses and electricity generated for self-consumption through in-house generation [1]. However, because the method used to compile these statistics was substantially revised from FY2016 onward as a result of electricity market liberalization, the contents of the data require a certain degree of scrutiny. At present, some inconsistencies are thought to exist in the wind-power data, so estimates were made from electricity supply-and-demand data (hourly data) published each month by general transmission and distribution operators. For solar power as well, FY2024 data are available from the Electric Power Survey Statistics, the electricity supply-and-demand data of general transmission and distribution operators, and FIT purchase volumes; and even compared with the FY2023 Comprehensive Energy Statistics, there is variation of around 10% in annual generation. In order to compare with past data, however, the Electric Power Survey Statistics data are used here (Figure 3). As a result, the estimate of annual solar power generation may contain an upward error of as much as about 20%. Since the Electric Power Survey Statistics do not compile data on self-consumption from residential solar power, this portion is estimated from electricity transmitted under the FIT system, assuming a self-consumption rate of 30%.
資源エネルギー庁が公表している電力調査統計などを集計することで日本国内の年間発電電力量に対する自然エネルギーの割合を推計している。この電力調査統計は、全国の電気事業者(2024年度は約1660社)に対して主に出力1MW以上の発電設備のデータを集計し、他事業者からの受電量や自家発電による自家消費の発電電力量なども調査した統計である[1]。ただし、この電力調査統計は電力自由化の影響で2016年度以降の統計データの集計方法が大幅に見直されているため、データの内容についてはある程度の精査が必要である。現状では風力発電のデータに一部不整合があると考えられるため、一般送配電事業者が毎月公表している電力需給データ(1時間データ)から推計した。また、太陽光発電についても、2024年度について電力調査統計、一般送配電事業者の電力需給、FIT買取電力量のデータがあり、2023年度の総合エネルギー統計と比べても年間発電電力量で1割程度のばらつきがあるが、過去のデータとの比較を行うために、ここでは電力調査統計のデータを採用している(図3)。このため、太陽光発電の年間発電電力量の推計については、最大2割程度の上振れ誤差がある可能性がある。なお、電力調査統計には住宅用太陽光の自家消費分のデータは集計されていないため、FIT制度での送電量から自家消費率(30%)を仮定して推計している。
Nuclear power, from zero annual generation in FY2014, has risen as reactors have been restarted in Kyushu, Kansai, and Shikoku, reaching 8.8% in FY2024. As a result, annual generation from nuclear power is about 30% of that from renewables.
原子力発電は、2014年度の年間発電量ゼロから九州、関西、四国での再稼働が進んだ結果、2024年度は8.8%となった。その結果、原子力の年間発電電力量は自然エネルギーの3割程度である。
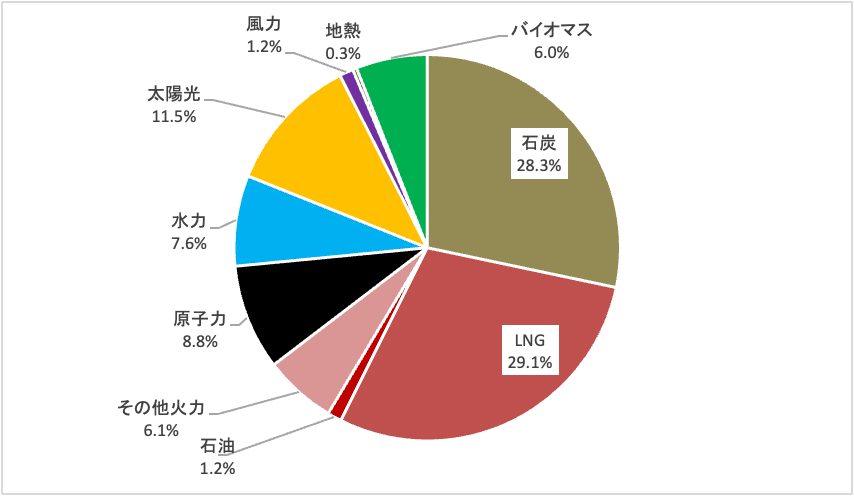
As shown in Figure 4, fossil fuels still account for a large share of Japan’s power mix, reaching 64.6% in FY2024, or about two-thirds of total annual electricity generation; nevertheless, this share has fallen by more than 20 percentage points from its peak in FY2022 (88%). In the FY2024 breakdown, natural gas (LNG) has the largest share at 29.1%, but is flat compared with the previous fiscal year. Coal also accounts for 28.3%, almost unchanged from the previous fiscal year (Table 1). Although there is a policy of phasing out inefficient coal-fired generation facilities, high-efficiency coal-fired power plants will remain beyond FY2030 if decarbonization measures are taken; if such measures do not advance, there is concern that they will be locked in over the long term. As an energy policy consistent with the Paris Agreement, the challenge is how quickly all coal-fired power can be phased out toward 2030, as in European countries.
図4に示す通り日本の電源構成においては化石燃料の占める割合は大きく、2024年度の年間発電電力量全体の約3分の2にあたる64.6%に達するが、その割合は2022年度のピーク時(88%)から20ポイント%以上減少している。2024年度の内訳は天然ガス(LNG)が29.1%と最も割合が高いが、前年度から横ばいである。石炭も28.3%を占めているが、前年度からほとんど変わっていない(表1)。石炭火力については効率の悪い発電設備をフェードアウト(段階的廃止)する方針はあるが、高効率の石炭火力発電設備は脱炭素化に向けた対策をした場合には2030年度以降も残ることになり、対策が進まない場合には長期的にロックインすることが懸念される。パリ協定に整合するエネルギー政策としては、欧州各国のように全ての石炭火力を2030年に向けて如何に早くフェーズアウト(全廃)できるかが課題である。
Figure 1: Trends in the share of electricity generation from renewables and nuclear power in Japan. Source: Prepared by ISEP from the Agency for Natural Resources and Energy’s Electric Power Survey Statistics and other sources.
図1:日本国内での自然エネルギーおよび原子力の発電量の割合のトレンド 出所:資源エネルギー庁の電力調査統計などからISEP作成
Figure 2: Monthly share of renewables in total electricity generation in Japan (FY2024). Source: Prepared by ISEP from Electric Power Survey Statistics and other sources. Figure 3: Comparison of annual solar power generation in Japan by statistical dataset. Source: Prepared by ISEP from each statistical dataset. Figure 4: Japan’s power mix (annual generation in FY2024). Source: Prepared by ISEP from the Agency for Natural Resources and Energy’s Electric Power Survey Statistics and other sources. Table 1: Changes in Japan’s power mix. Source: Prepared by ISEP from the Agency for Natural Resources and Energy’s Electric Power Survey Statistics and other sources.
図2: 日本国内の全発電電力量に占める月別の自然エネルギーの割合(2024年度) 出所:電力調査統計などよりISEP作成 図3: 統計データによる日本国内の太陽光発電の年間電力量の比較 出所:各統計データよりISEP作成 図4:日本国内の電源構成(2024年度の年間発電量) 出所:資源エネルギー庁「電力調査統計」などからISEPが作成 表1:日本国内の電源構成の推移 出所:資源エネルギー庁「電力調査統計」などからISEPが作成
Figure 5 shows the transition in Japan’s power mix from the 1990s onward. Total electricity generation has declined by about 20% from its peak year (2007), and in FY2023 also decreased from the previous fiscal year. Annual renewable electricity generation had remained at 10% of total generation until FY2010, but had more than doubled to 26% by FY2024. Since March 11, nuclear power generation has fallen sharply, from more than 25% before March 11 to about 9%, or roughly one-third of its former level. The share of thermal power generation from fossil fuels rose to about 90% after March 11, but has since fallen to around 65%.
日本国内の電源構成の推移を1990年代から図5に示す。総発電電力量はピーク時(2007年)から約2割減少しており、2023年度も前年度から減少した。自然エネルギーの年間発電電力量は、2010年度まで総発電電力量の10%で推移してきたが、2024年度までに26%と倍増した。3.11以降、原子力発電の発電電力量は激減し、3.11前の25%以上から約9%と3分の1程度となっている。化石燃料による火力発電の割合は、3.11後に約90%にまで上昇したが、65%程度に減少してきている。
Figure 5: Changes in Japan’s power mix (annual electricity generation). Source: Prepared by ISEP from Electric Power Survey Statistics data and other sources.図5: 日本国内の電源構成(年間発電電力量)の推移 出所: 電力調査統計データなどからISEP作成
Figure 6 shows cumulative installed capacity of renewable power generation facilities in Japan, excluding large-scale hydropower. In the 1990s, large-scale hydropower was the main renewable energy source in Japan, and installed capacity of other renewables was very small, at about 5 million kW. In the 2000s, deployment of some forms of “new energy” advanced under the RPS system from 2003, and in 2009 the FIT system for surplus solar electricity began; by FY2011, renewable power generation facilities other than large-scale hydropower had also grown roughly threefold, to about 15 million kW. Under the FIT system, which began in 2021 and covered all quantities and all categories, solar power capacity increased by about ten times over the twelve years from FY2012 to FY2024, reaching 73 million kW on an AC basis, and renewable power generation facilities excluding large-scale hydropower reached about 93 million kW. Within this total, cumulative installed capacity of wind power was 6.2 million kW, almost all of it onshore wind. This was about 2.4 times the level of eleven years earlier, in FY2012, but still only one-twelfth of solar power capacity. Cumulative installed biomass power capacity was about 8.5 million kW, having increased by about 2.5 times over these eleven years as facilities using woody biomass as fuel grew. For geothermal power and small hydropower, new deployment of small-scale facilities advanced, but there were also many replacements; cumulative installed capacity has scarcely increased, standing at about 600,000 kW for geothermal power and about 4.5 million kW for small hydropower.
日本国内の自然エネルギー発電設備(大規模水力発電を除く)の累積導入量を図6に示す。1990年代は、国内の自然エネルギーは大規模水力発電が主力でそれ以外の導入量はとても小さかった(500万kW程度)。2000年台に入り、2003年からRPS制度により一部の「新エネルギー」の導入が進み、2009年からは太陽光の余剰電力に対するFIT制度がスタートして、2011年度までには大規模水力発電以外の自然エネルギー発電設備も3倍程度になった(1500万kW程度)。2021年からスタートした全量全種を対象としたFIT制度により、太陽光発電は2012年度から2024年度の12年間で設備容量は約10倍の7300万kW(ACベース)となり、自然エネルギー発電設備(大規模水力を除く)は約9300万kWに達した。その中で、風力発電の累積導入量は620万kW(ほとんど陸上風力)で、2012年度からの11年間で約2.4倍となったが、太陽光発電の設備容量の12分の1に留まる。バイオマス発電の累積導入量は約850万kWで、この11年間で木質バイオマスを燃料とする設備が増加して約2.5倍となった。地熱発電および小水力発電については、小規模な設備の新規導入が進んだが、リプレースも多く、地熱発電は約60万kW、小水力発電は約450万kWと累積導入量はほとんど増加していない。
Figure 6: Changes in cumulative installed capacity of renewable power generation facilities in Japan, excluding large-scale hydropower. Source: Prepared by ISEP from Agency for Natural Resources and Energy data and other sources. Deployment status of renewables under the FIT system.
図6: 日本国内の自然エネルギー発電設備(大規模水力を除く)の累積導入量の推移 出所: 資源エネルギー庁データなどからISEP作成 FIT制度による自然エネルギーの導入状況
Capacity certified for projects under the FIT system, which began in July 2012, reached 111.1 million kW by the end of FY2023, including transitional certifications from before the system began; of this, 72%, or 79.5 million kW, was solar power (Figure 7, Table 2) [2]. Facilities that had actually begun operation totaled 87.4 million kW, leaving 23.44 million kW not yet in operation. The operation commencement rate for commercial solar power (10 kW or more) has reached about 90%. For wind power (20 kW or more), about 16.3 million kW has been certified for projects, including transitional certifications, but because of environmental assessment procedures and grid-connection procedures, only about 6 million kW, or roughly 31%, has begun operation. In electricity areas with high shares of variable renewable energy (VRE), such as solar power, curtailment of VRE output has been implemented since FY2022 (and since FY2018 in the Kyushu area) [3]. For small and medium hydropower, project certification remains at about 2.75 million kW, of which 1.54 million kW has begun operation, though a considerable share consists of replacement of existing facilities. Geothermal power remains low, with 220,000 kW certified for projects, but about 140,000 kW has begun operation, showing that development is advancing. About 9.65 million kW of biomass power has been certified for projects, but more than 70% is said to consist of facilities fueled by imported wood and agricultural residues such as PKS and palm oil. Biomass power facilities that have begun operation total 6.5 million kW, exceeding the capacity of wind power, and the operation commencement rate has risen to 67%. With respect to biomass fuels imported from overseas, the sustainability of liquid biomass in particular, such as palm oil, has been viewed as a problem, and work is proceeding to establish sustainability criteria [4].
2012年7月にスタートしたFIT制度により事業認定された設備容量は、FIT制度開始前からの移行認定を含み2023年度末までに1億1110万kWになっているが、その内72%の7950万kWが太陽光である(図7、表2)[2]。実際に運転を開始している設備は8740万kWで2344万kWが未稼働の状況である。事業用(10kW以上)の太陽光発電の運転開始率は約90%に達している。風力発電(20kW以上)は約1630万kWが移行認定を含み事業認定されているが、環境アセスメントの手続きや電力系統への接続手続きの関係で約31%にあたる約600万kWしか運転を開始していない。なお、太陽光発電などの変動性自然エネルギー(VRE)比率の高い電力エリアでは、VREの出力抑制が2022年度から実施されている(九州エリアでは2018年度から)[3]。中小水力については、事業認定が275万kW程度に留まっており、そのうち154万kWが運転を開始しているが、そのうちのかなりの割合が既存設備のリプレースである。地熱発電は事業認定が22万kWと少ない状況だが、運転開始は約14万kWと開発が進んできている。バイオマス発電は約965万kWが事業認定されているが、その7割以上が海外からの木材や農業残さ(PKSやパーム油)を燃料とする設備といわれている。運転を開始したバイオマス発電は650万kWで、風力発電の設備容量を上回っており、運転開始率も67%と高くなってきている。海外から輸入するバイオマス燃料をめぐっては特に液体バイオマス(パーム油など)の持続可能性が問題視されており、持続可能性の基準の設定が進められている[4]。
Figure 7: Project certification, installed capacity (operation commenced), and non-operating facilities under the FIT system (end of FY2023). Source: Prepared by ISEP from Agency for Natural Resources and Energy data.
図7: FIT制度における設備の事業認定、導入量(運転開始)および未稼働設備(2023年度末) 出所:資源エネルギー庁データよりISEP作成
Table 2: Project certification, installed and non-operating facilities under the FIT system (end of FY2023), including transitional certifications. Source: Prepared from Agency for Natural Resources and Energy data.
表2: FIT制度における設備の事業認定、導入済および未稼働(2023年度末)移行認定を含む 出所:資源エネルギー庁データより作成
Figure 8 shows changes in cumulative installed capacity of renewable power generation facilities under the FIT system. Facility certification had advanced to nearly 120 million kW by FY2016, and non-operating facilities increased; but from FY2017 onward, with revisions to the FIT system including transition to project certification, the operation commencement rate had reached about 76% by the end of FY2022. For solar power in particular, the operation commencement rate has reached nearly 90%.
FIT制度による自然エネルギー発電設備の累積導入量の推移を図8に示す。2016年度までに設備認定が1億2千万kW近くまで進み、未稼働の設備が増えたが、2017年度以降、FIT制度の改定で事業認定への移行などもあり、2022年度末までに運転開始率は約76%に達した。特に太陽光発電の運転開始率は90%近くに達している。
Figure 8: Changes in cumulative installed capacity of renewable power generation facilities under the FIT system, certified projects, and non-operating facilities. Source: Prepared by ISEP from Agency for Natural Resources and Energy data.
図8:FIT制度による自然エネルギー発電設備の累積導入量と事業認定設備・未稼働の推移 出所:資源エネルギー庁データよりISEP作成
Looking at annual installations under the FIT system by fiscal year, FY2014 was the largest, reaching nearly 10 million kW, centered on solar power; thereafter the figure turned downward, and from FY2017 annual installations were around 6 million to 7 million kW, before declining to about 5 million kW in FY2023 (Figure 9). For solar power, annual installations exceeded 5 million kW through FY2020, but new purchase prices also fell rapidly, an auction system was introduced for large-scale projects, and the FIP system began in FY2022; as a result, installations fell to the 4 million kW range from FY2021 and to 3 million kW in FY2023. Wind power, whose deployment had been constrained until now, has shown a tendency toward increased annual installations. Wind power had previously remained at about 500,000 kW or less, but in FY2022 more than 1 million kW was newly installed in a single year. Biomass power has also seen installations of more than 400,000 kW since FY2017, with the largest annual addition, 1.31 million kW, in FY2022, but in FY2023 it remained at about 600,000 kW. Geothermal power saw about 40,000 kW installed in FY2023, the second-largest scale after about 50,000 kW in FY2019.
年度毎のFIT制度による年間導入量の推移をみると2014年度が太陽光を中心に1000万kW近くに達して最も大きかったが、その後に減少に転じて2017年度からは年間600万kWから700万kW程度の導入量となっていたが、2023年度は約500万kWまで減少した (図9)。太陽光発電については、2020年度までは500万kW以上の年間導入量だったが、新規の買取価格も急速に低下し、大規模な案件に対する入札制度や2022年度からFIP制度も始まったことから、2021年度からは400万kW台に、2023年度は300万kWまで減少した。一方、これまで導入量が抑えられてきた風力については年間導入量が増加する傾向があり、これまで風力発電は約50万kW以下で推移してきたが、2022年度には年間100万kW以上が新規に導入された。バイオマス発電も2017年度以降、40万kW以上導入され、2022年度は最大の年間131万kWが導入されたが、2023年度は約60万kWに留まった。地熱発電は2023年度に約4万kWが導入され、2019年度の約5万kWに次ぐ導入規模となった。
Figure 9: Changes in annual installations of renewable power generation facilities under the FIT system. Source: Prepared by ISEP from Agency for Natural Resources and Energy data.図9: FIT制度による自然エネルギー発電設備の年間導入量の推移 出所:資源エネルギー庁データよりISEP作成
The total amount paid for purchases under the FIT system is expected to rise slightly in FY2024 to 4.8 trillion yen, from 4.7 trillion yen in FY2023, but avoided costs, corresponding to the reduction in fossil fuels for electric power companies, are expected to fall sharply to about 2.1 trillion yen from the previous fiscal year’s 3.6 trillion yen, owing to factors such as the surge in fossil fuel prices. As a result, the surcharge on electricity rates in FY2024 rose sharply from the previous fiscal year’s 1.4 yen/kWh, reaching 3.49 yen/kWh, about the same as in FY2022 (Figure 10). Amid this, a fundamental review of the current FIT system began in FY2022. The system changed substantially: FIT is maintained, with conditions, for locally utilized power sources such as small-scale solar including solar sharing, small hydropower, small biomass, and small geothermal, while a new FIP system has been introduced for competitive power sources such as large-scale solar and wind [5]. However, this review of the FIT system contains various problems, and proposals have been made to promote the deployment of renewable energy in earnest [6].
FIT制度による買取金額の総額が2024年度には4.8兆円と2023年度の4.7兆円から少し増加する見込みだが、電力会社の化石燃料の減少分である回避可能費用は、化石燃料価格の高騰などにより2.1兆円程度と、前年度の3.6兆円から大幅に減少する見込みである。そのため、2024年度の電気料金への賦課金は前年度の1.4円/kWhから大幅に上昇し、2022年度と同程度の3.49円/kWhとなった(図10)。その中で、2022年度からの現行のFIT制度の根本的な見直しが始まり、FIT制度は地域活用電源(ソーラーシェアリングを含む小規模太陽光、小規模水力、小規模バイオマス、小規模地熱など)では条件つきで維持される一方で、競争電源(大規模太陽光、風力)については新たにFIP制度が導入されるなど大きく変わった[5]。しかし、このFIT制度の見直しには様々な問題点があり、自然エネルギーの導入を本格的に促進する提言を行ってきている[6]。
Figure 10: Changes in purchase costs, surcharges, and other items under the FIT system. Source: Prepared by ISEP from Agency for Natural Resources and Energy data. Share of renewables in Japan’s electricity supply and demand.
図10: FIT制度による買取費用および賦課金などの推移 出所:資源エネルギー庁データよりISEP作成 日本国内の電力需給における自然エネルギーの割合
Based on electricity supply-and-demand data published monthly by the ten general transmission and distribution operators for each area nationwide, data for the full year of FY2023 were compiled, focusing on the share of renewables in grid electricity demand and related indicators. For Japan’s electricity supply-and-demand data, ISEP’s Energy Chart makes it possible to analyze published data interactively and accessibly through a variety of graphs [7].
日本全国のエリア毎に一般送配電事業者10社により毎月公開されている電力需給データに基づき系統電力需要に対する自然エネルギーの割合などを中心に2023年度の一年間のデータを集計した。日本国内の電力需給データについてはISEPのEnergy Chartでは公表されたデータから様々なグラフでインタラクティブに分かり易くデータを分析できる[7]。
The share of renewables in annual electricity demand for Japan as a whole averaged 22.6% in FY2023, up from the FY2022 annual average of 21.4% (Figure 11). In the breakdown, solar power accounted for 10.7%; combined with wind power’s 1.2%, the share of variable renewable energy, or VRE, was 11.9%. Solar increased from 10.0% in FY2023, and its share is now larger than hydropower’s 8.0%. Biomass power increased from 2.1% in the previous fiscal year to 2.4%. The nuclear power share in FY2023, meanwhile, was 9.3%, up from 6.2% the year before. In monthly averages for the share of renewables in electricity demand for Japan as a whole, May 2023 was the highest at 32.5%, up from 30.3% the previous year. At that time, the share of VRE, or variable renewable energy, was also at its maximum, 16.5%, up from 15.4% in April of the previous year. Its components were solar power at 15.4% and wind power at 1.1%.
日本全体の年間電力需要量に対する自然エネルギーの割合は2023年度の平均値では22.6%となり、2022年度の年平均21.4%から増加した(図11)。内訳としては太陽光発電の割合が10.7% となり、風力発電の1.2%と合わせて変動性自然エネルギーVREの割合は11.9%となった。太陽光は2023年度の10.0%から増加しており、水力発電の8.0%より割合が大きくなっている。バイオマス発電は前年度の2.1%から2.4%に増えている。一方、2023年度の原発の割合は9.3%となり、前年の6.2%から増加した。日本全体の自然エネルギーの電力需要に占める割合の月別の平均値では、2023年5月が32.5%と最も高くなっており、前年の30.3%から増加している。このときVRE(変動性自然エネルギー)の割合も最大で16.5%となり、前年4月の15.4%から増加した。その内訳は、太陽光発電が15.4%、風力発電が1.1%となっている。
Figure 11: Monthly shares of renewables and nuclear power in electricity supply and demand nationwide in Japan (FY2024). Source: Prepared from electricity supply-and-demand data of general transmission and distribution operators.
図11: 月別の日本全国の電力需給における自然エネルギーおよび原発の割合(2024年度) 出所:一般送配電事業社の電力需給データより作成
In FY2023, the areas with the highest annual average shares of renewables in electricity demand were the Hokkaido and Tohoku areas, both at 41.1%; in each area, hydropower accounted for a relatively large share, at 15.6% and 14.6%, respectively, while solar power also reached 10.4% and 13.6% (Figure 12, Table 3). Their wind power shares, at 8.0% and 5.8%, were among the highest nationwide, and their VRE shares were 18.4% and 19.4%, respectively. Biomass power shares were also high nationwide, at 6.7% and 5.5%, respectively, and geothermal power accounted for 0.3% and 1.5%. The Hokuriku area ranked third, with a renewable energy share of 35.8%, but hydropower accounted for a large 26.8%, while VRE had a low share of 6.7%.
2023年度の電力需要に対する自然エネルギーの割合の年間平均値が最も高かったのは北海道エリアおよび東北エリアの41.1%だったが、いずれのエリアも水力発電が15.6%、14.6%と比較的大きな割合を占めて、太陽光発電もそれぞれ10.4%、13.6%に達している(図12、表3)。風力発電の割合が8.0%、5.8%と全国の中でも最も高くなっており、VREの割合はそれぞれ18.4%、19.4%になった。バイオマス発電の割合もそれぞれ6.7%、5.5%と全国でも高く、地熱発電もそれぞれ0.3%、1.5%ある。第3位の北陸エリアの自然エネルギーの割合は35.8%だったが、水力発電が26.8%と大きな割合を占めており、VREは6.7%と低い割合だった。
In FY2023, there were five areas where the share of renewables exceeded 100% of demand at the peak hourly value: the Shikoku area, with a maximum of 123%, as well as the Tohoku area (117%), the Hokkaido area (111%), and the Hokuriku area (100%). In areas such as Kyushu, where the share had previously exceeded 100%, the maximum at peak times was below 100% because of the effects of output curtailment.
2023年度は1時間値のピークで自然エネルギーの割合が100%を超えるエリアとして、最大123%の四国エリアをはじめ、東北エリア(117%)、北海道エリア(111%)、北陸エリア(100%)の5エリアだった。以前に100%を超えることもあった九州エリアなどでは出力抑制の影響でピーク時の最大でも100%未満になっている。
In the Kyushu area, where VRE output curtailment has already been implemented since 2018, the VRE curtailment rate has reached 8.4%; in FY2023, VRE output curtailment was implemented in eight areas other than Tokyo Electric Power (the national average was 1.8%). The curtailment rate in the Chugoku area was 3.6%, the second highest after Kyushu; in the five areas other than Shikoku, at 1.8%, it was below 1%. In the Shikoku area, where the solar share is 16.7%, the highest nationwide, the renewable energy share was 35.0%; the VRE share, combined with wind’s 2.0%, was 18.7%, the highest in the country. In the Kyushu area, by contrast, the curtailment rate in FY2023 was the highest nationwide, and the post-curtailment VRE share was 16.7%, while the pre-curtailment VRE share was 18.2%. In Kyushu, the share of nuclear power, which under priority dispatch rules is treated as baseload power and is not curtailed until the end, has also risen with reactor restarts; at times four nuclear reactors, with a combined output of about 4 million kW, were in operation, and the FY2023 share reached 37.4%. On the Kyushu mainland, following the increase in solar power after October 2018, full-scale curtailment of solar and wind output has been carried out intermittently; over the year of FY2023, the curtailment rate more than doubled from the previous fiscal year’s 3.0% to 8.4%, the highest ever recorded.
すでにVREの出力抑制を2018年から実施している九州エリアではVRE出力抑制率が8.4%に達しているが、東京電力以外の8エリアで2023年度にVREの出力抑制が実施された(全国平均は1.8%)。中国エリアの抑制率が3.6%で九州エリアの次に高く、四国の1.8%以外の5エリアは1%未満となっている。太陽光の割合が16.7%で全国でも最も高いエリアになっている四国エリアでは自然エネルギーの割合は35.0%となったが、VREの割合も風力の2.0%と合わせて18.7%となって全国で最も高くなっている。一方、九州エリアでは、2023年度は出力抑制率が全国で最も高く、抑制後のVREの割合が16.7%だったが、出力抑制前のVREの割合は18.2%だった。九州エリアでは、ベースロード電源として優先給電ルールに基づき出力抑制を最後まで行わない原子力発電の比率も再稼働により高まり、4基の原発(合計出力約400万kW)が稼働している時期もあり、2023年度の割合は37.4%に達している。九州本土エリアにおいて2018年10月以降、太陽光発電の増加に伴い、本格的な太陽光や風力の出力抑制が断続的に実施され、2023年度の1年間では出力抑制率は前年度の3.0%から8.4%と2倍以上増加して過去最高になった。
Figure 12: Share of renewables in electricity supply and demand by area (FY2024). Source: Prepared from electricity supply-and-demand data of general transmission and distribution operators. Table 3: Share of renewables in demand by electricity supply-and-demand area. Source: Prepared from electricity supply-and-demand data of general transmission and distribution operators.
図12: エリア別の電力需給における自然エネルギーの割合(2024年度) 出所:一般送配電事業社の電力需給データより作成 表3: 電力需給エリア別の需要に対する自然エネルギーの割合 出所:一般送配電事業社の電力需給データより作成
In FY2023, there were six areas where renewables exceeded 100% of electricity demand on an hourly basis: Hokkaido, Tohoku, Hokuriku, Chubu, Shikoku, and Chugoku (line graph in Figure 12). In the previous fiscal year, FY2022, there had been seven areas including Kyushu, but in the Kyushu area the share did not exceed 100% in 2023 as the curtailment rate increased (the maximum was 92.9%). In the Shikoku area, meanwhile, the share of renewables in electricity demand reached 123.1% during the 10 a.m. hour on May 3, 2023. At this peak, solar accounted for 91.7% and wind for 1.4%, making the VRE share 93.1% (the maximum for solar was 93.2%). Together with hydropower at 26.4% and biomass at 3.7%, the total reached 123.1%. Even in metropolitan areas, in the Chubu area where output control has begun, the renewable energy share reached a maximum of 109.2% (solar’s maximum was 92%). In the Kyushu area, where output curtailment is being implemented, the hourly share of solar power reached a maximum of 83.2% at its peak. At that time wind was 0.1%, so the VRE share remained at 83.3%, and output curtailment was not implemented. In the Kyushu area, however, the pre-curtailment VRE share reached a maximum of 132.5% during the noon hour on April 9, 2023. At that time, VRE output curtailment reduced the VRE share to 53.1% (a curtailment rate of 60%).
2023年度には1時間値で自然エネルギーが電力需要の100%を超えるエリアが、北海道、東北、北陸、中部、四国、中国の6エリアになった(図12の折れ線グラフ)。前年度の2022年度は九州エリアを加えた7エリアだったが、九州エリアでは出力抑制率の増加に伴い2023年は100%を超えることがなかった(最大は92.9%)。一方、四国エリアでは、2023年5月3日10時台に自然エネルギーの電力需要に対する割合が123.1%に達した。このピーク時に太陽光が91.7%、風力が1.4%でVREの割合が93.1%だった(太陽光の最大は93.2%)。さらに、水力の26.4%、バイオマス3.7%を合わせて123.1%となっている。大都市圏でも、出力制御の始まった中部エリアで、自然エネルギーの割合が最大109.2%に達している(太陽光は最大92%)。出力抑制が実施されている九州エリアでは、1時間値で太陽光の割合がピーク時に最大83.2%だった。このとき風力は0.1%で、VRE比率が83.3%に留まっており、出力抑制も実施されていない。一方、九州エリアでは、出力抑制前のVRE比率は、最大で132.5%に達している(2023年4月9日12時台)。このとき、VREの出力抑制によりVRE比率は53.1%まで抑制されている(出力抑制率60%)。
Figure 13: VRE output curtailment rates by electricity area (FY2024). Source: Prepared from electricity supply-and-demand data of general transmission and distribution operators. Reference materials.図13 電力エリア別のVRE出力抑制率(2024年度) 出所:一般送配電事業社の電力需給データより作成 参考資料
[1] Agency for Natural Resources and Energy, “Electric Power Survey Statistics,” http://www.enecho.meti.go.jp/statistics/electric_power/ep002/
[1] 資源エネルギー庁「電力調査統計」http://www.enecho.meti.go.jp/statistics/electric_power/ep002/
[2] Agency for Natural Resources and Energy, “Website for Public Disclosure of Information under the Act on Special Measures Concerning Promotion of Utilization of Electricity from Renewable Energy Sources,” https://www.fit-portal.go.jp/PublicInfoSummary
[2] 資源エネルギー庁「再生可能エネルギー電気の利用の促進に関する特別措置法 情報公表用ウェブサイト」https://www.fit-portal.go.jp/PublicInfoSummary
[3] ISEP, “Curtailment of Solar and Wind Output by Tohoku, Shikoku, and Chugoku Electric Power Could Have Been Sufficiently Avoided” (May 2022), https://www.isep.or.jp/archives/library/13912
[3] ISEP「東北・四国・中国電力による太陽光・風力の出力抑制は十分に避けられた」(2022年5月) https://www.isep.or.jp/archives/library/13912
[4] “Joint Proposal on the Sustainability of Biomass Power Generation” (July 2019), https://www.isep.or.jp/archives/library/12006
[4] 「バイオマス発電の持続可能性に関する共同提言」(2019年7月) https://www.isep.or.jp/archives/library/12006
[5] “Bill to Partially Amend the Electricity Business Act and Other Acts to Establish a Resilient and Sustainable Electricity Supply System” (February 2020), https://www.meti.go.jp/press/2019/02/20200225001/20200225001.html
[5] 「強靱かつ持続可能な電気供給体制の確立を図るための電気事業法等の一部を改正する法律案」(2020年2月) https://www.meti.go.jp/press/2019/02/20200225001/20200225001.html
[6] ISEP, “A ‘Green Recovery’ from the Regions: Overcoming the Three Crises Caused by COVID-19 (Economic Crisis, Climate Crisis, and Social Division)” (July 2020), https://www.isep.or.jp/archives/library/12694
[6] ISEP「地域からの「緑の復興」を〜新型コロナによる3つの危機(経済危機・気候危機・社会分断)を超える〜」2020年7月 https://www.isep.or.jp/archives/library/12694